
How to Read a Profit and Loss Statement
Whether you're just starting out or a seasoned business owner, it is imperative to understand the financial health of your business. This can be done via a variety of different types of analyses whether you are using an software or a spreadsheet to do your accounting. In terms of the big picture and overall performance of your business, the reports that are collectively referred to as the financial statements are the most crucial .
The financial statements typically comprise three reports: the balance sheet, profit and loss statement and statement of cash flows.
Some of you might be intimidated by the technical terminology of accounting. But, in reality , the profit and loss statement (also know as the income statement) is actually quite easy to read and understand. This is especially true as it relates to your own business since most of you already have an innate sense of your business numbers.
In case you prefer to watch or to see the reading of a profit or loss statement in action :), I have an accompanying video tutorial on how to make sense of your profit and loss statement :
What is a Profit and Loss Statement?
A Profit and Loss Statement, also known as an income statement or P&L is a financial report that summarizes the revenues (also referred to as sales), direct costs, and expenses incurred during a specific period.
It is essentially a big picture view of how much you sold minus the costs you incurred to make those sales. The final number on a profit or loss statement is the net profit where the amount of sales you had were higher than your expenses OR net loss where the expenses exceeded the sales.
The P&L is essential for making informed business decisions and is often required by investors, financial institutions for loan/grant applications and revenue agencies (e.g. Revenue Canada and Revenue Quebec as part of your tax return).
What is the Structure of the Profit and Loss Statement
The structure of a profit and loss statement is pretty typical across businesses and industries. A simple profit and loss example looks like the following (although this is not that different from a large public company):
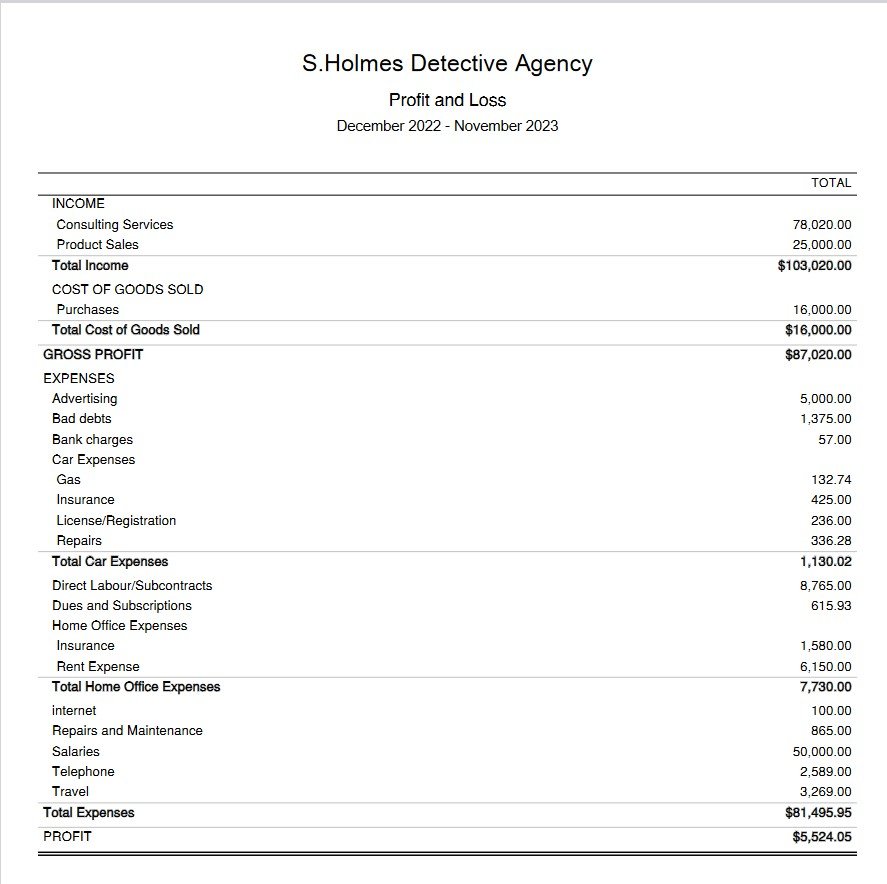
The categories on the profit and loss statement are derived from the chart of accounts. When setting up the chart of accounts, you assign the accounts or categories a name and an account type. Income, Cost of Goods Sold, Expenses, Other Income and Other Expenses are examples of account types that would go on the profit and loss report as sub-headings.
What Are the Sections in the P&L Statement
The structure of a P&L statement can be broadly divided into several key sections:
Revenue/Sales:
This is also referred to as the top line of your P&L statement. It includes all of your sales to customers/clients and any other sources of primary income that arise from your business activities. This includes direct sales of products and services but might also include ad revenue if you are content creator, royalties for authors, affiliate income, commissions, rental income if you have investment properties etc. This does not include non primary sources of income, that are incidental to your business. This should be included in a separate section called Other Income.
Cost of Goods Sold (COGS):
In this section , you would include all the direct costs associated with the production of goods your business sells. This might include raw materials, shipping, labels, packaging, direct costs of labour to make your product etc For example, if you sell surveillance equipment, you would include the cost of the software or audio recording devices, cameras etc. Note that COGS only relates to product based businesses (the “Goods” in the title refers to products)
However, if you sell services, you might also have direct costs. Thes are referred to as Cost of Sales. For example, if you simply provide surveillance services (rather than selling the equipment per example above), all of the same costs would be costs of services. Additionally, if you pay subcontractors or employees to specifically do the surveillance, then you might also include them in Cost of Sales.
Subtracting COGS from your revenue gives you the Gross Profit, which is a measure of your core profitability before overhead costs. This is an important metric especially in comparison to previous periods and to other businesses in the same industry.
Expenses:
This section includes all the operational expenses that are not directly tied to the production of goods or services. . Often you will see them referred to as Selling, General, and Administrative Expenses (SG&A) or overhead expenses.
Common business expenses include:
Rent,
Utilities,
Salaries
Office expenses
Dues and subscriptions
Other Income and Expenses
This will include items that aren’t directly related to operating the business. These include:
Interest on debt
Depreciation and amortization
Taxes
Investment income
Other non recurring items
Net Profit or Loss:
The net profit or loss is simply calculated as follows:
Sales
Minus
Cost of goods sold or cost of services
Minus
Operating expenses
Plus
Other Income
Minus
Other Expenses
= PROFIT, if the amount is positive OR
= LOSS, if the amount is negative
Net profit or loss is also referred to as the bottom line. This number tells you the actual profitability of your business after all expenses have been paid i.e. is your business making or losing money.
Analyzing Your Profit and Loss
Once you understand the components and calculation of the profit and loss statement, you can then begin to analyse it. Some types of analysis include:
Trends: Compare your current P&L statement with previous periods to identify trends in revenue, costs, and expenses. Are your revenues growing faster than your expenses? This could indicate improving efficiency. For example, if your advertising expenses are a higher percentage of sales than planned, it might be time to adjust your marketing strategy.
Margins: Look at your gross profit margin and net profit margin. The profit margin helps you understand how much of your sales is actual profit after all expenses are paid. A declining profit margin could indicate rising costs or pricing issues, which might require strategic adjustments. These ratios are indicators of your business’s health and efficiency.
Unexpected Changes: Keep an eye out for significant deviations from the norm. A sudden increase in expenses or a drastic drop in revenue might warrant a deeper investigation.
Tips for Interacting with Your P&L
Regular Review: Make it a habit to review your P&L statement regularly. This helps catch issues early and adjust strategies promptly.
Customization: Tailor your P&L categories to match the unique aspects of your business. This customization makes the data more relevant and easier to analyze.
Use Percentages: Viewing expenses as percentages of total income can help pinpoint areas that are out of line with industry standards or your own historical performance.
A Profit and Loss Statement is not just a collection of numbers—it's a story about your business's performance. By regularly reviewing your P&L statement, you can make informed decisions that drive your business forward. Remember, the goal is not just to read this document but to understand the financial narrative it tells. It can also be interesting and even exciting to see your sales and profits grow and to find ways to improve your business by simply looking at your reports.
Sign up to my newsletter to receive simple, actionable tips for managing your business finances and improve your financial literacy.